The Chromozone / IAL Biology / Unit 4 / Topic 5
Directed study: core practical 11, studying a habitat
Directed study after the two lessons on core practical 11. Part A checks what you remember, Part B is exam-style questions like those in the Unit 6 paper, and Part C goes back to statistics and earlier lessons in Topic 5. You need a calculator. It takes about 36 minutes and is worth 29 marks. Work through it on your own after the lesson Core practical 11 (lesson 2 of 2). Type your answers in the boxes, then hand them in at the bottom of the page. The mark schemes open after you hand in: then mark yourself point by point and correct your work in a different colour. The spec point in brackets after a question tells you where to revise. Teachers: this is the page to set as homework.
Teach these first
This page builds on these lessons. Teach them before students start here:
Part A: what do you remember? (6 marks) 6 min
Answer from memory first. Then look back at your notes for anything you could not remember.
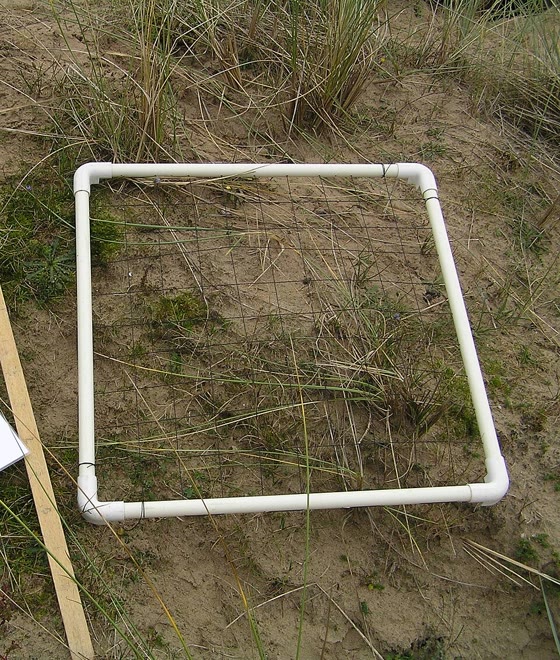
A1. In lesson 1, why should the same person decide which squares of the quadrat count towards the percentage cover? (5.14) (1)

A2. Name the type of transect you used in lesson 1, and explain how it differs from a continuous belt transect. (5.14) (2)
A3. Give one reason why three light meter readings were taken at each quadrat and a mean was calculated. (5.14) (1)
A4. Explain the difference between the abundance and the distribution of a species. (5.14) (2)
Reveal the answers to Part A
A1 (1)
- Judging "more than half covered" is subjective; one person keeps it consistent (1)
- ACCEPT same person / same method each time
A2 (2)
- Interrupted belt transect (1)
- Quadrats at regular intervals, not end to end along the whole tape (1)
- DO NOT ACCEPT "belt transect" alone for the first point
A3 (1)
- Light changes from moment to moment (clouds), so a mean is more reliable (1)
- ACCEPT to make the readings more reliable / to reduce the effect of anomalies
A4 (2)
- Abundance: how many individuals of the species are in an area (1)
- Distribution: where in the area the species is found (1)
- DO NOT ACCEPT the two definitions the wrong way round
Part B, question 1: choosing sampling sites (2 marks) 2 min
Question 1. A student wants to compare the mass of earthworms in the soil of a rubber plantation and of a nearby forest. Describe how she should choose six sampling sites at random in each area. (2)
Reveal the mark scheme for question 1
1 (2)
- Lay two tapes at right angles to make a grid over each area (1)
- Use random numbers (a generator or table) as coordinates for each site (1)
- DO NOT ACCEPT "choose sites without looking" or "throw the quadrat"
Part B, question 2: plan a field study (6 marks) 8 min
Question 2. A field has a footpath across it. Plan a study to find out whether trampling affects the percentage cover of daisies, by comparing ground beside the path with ground well away from it. Include how you would sample, what you would control or monitor, and how you would analyse the results. (6)
Reveal the mark scheme for question 2
2 (6): max 6
- Random sampling in each area: grid and random coordinates (1)
- Same size of quadrat, e.g. 0.5 m × 0.5 m, in both areas (1)
- Percentage cover: count squares more than half covered by daisies (1)
- At least 10 quadrats in each area (1)
- Same field and same day, so light and weather are similar (1)
- Monitor an abiotic factor, e.g. soil compaction or soil water (1)
- Calculate the mean cover in each area and compare them with a t-test (1)
- DO NOT ACCEPT Spearman's rank or chi-squared for comparing two means
- Max 6
Part B, question 3: an abiotic factor along a transect (3 marks) 4 min
Question 3. A transect runs from a pine wood out into open heathland. Describe how a student could measure the pH of the soil at each quadrat so that the readings can be compared. (3)
Reveal the mark scheme for question 3
3 (3): max 3
- Take the same volume of soil from the same depth at each quadrat (1)
- Mix it with the same volume of distilled water (1)
- Measure with a pH meter or probe (or a soil test kit) (1)
- Repeat at each quadrat and calculate a mean, all on the same day (1)
- ACCEPT distilled water, as the pH of tap water varies
- Max 3
Part B, question 4: is the conclusion valid? (3 marks) 3 min
Question 4. A student counted the lichen species on five trees beside a busy road and on five trees in a park 2 km away. She concluded that air pollution from traffic reduces the number of lichen species. Explain why her results might not support a valid conclusion. (3)
Reveal the mark scheme for question 4
4 (3): max 3
- Small sample: only five trees at one site of each type (1)
- Other variables may differ: tree species, age, bark, light, humidity (1)
- She did not measure the air pollution itself (1)
- No statistical test to show the difference is significant (1)
- IGNORE "human error"
- Max 3
Part B, question 5: a dune transect (2 marks) 2 min
Question 5. Along a transect up a sand dune, a student calculated rs = 0.79 for the distance from the sea and the percentage cover of moss, using 9 quadrats. The critical value for 9 pairs at p = 0.05 is 0.700. Give a conclusion. (2)
Reveal the mark scheme for question 5
5 (2)
- 0.79 is greater than 0.700, so reject the null hypothesis (1)
- Significant positive correlation: more moss further from the sea (1)
- ALLOW ecf from the comparison with the critical value
Part C: spaced practice from earlier in Topic 5 (7 marks) 8 min
These questions go back to earlier lessons. Try them without your notes first.
C1. 60 woodlice were put into a choice chamber with a damp side and a dry side. After 10 minutes, 41 were on the damp side and 19 on the dry side. Calculate χ2 and say whether the woodlice show a significant preference. The critical value for 1 degree of freedom at p = 0.05 is 3.84. (5.14) (3)
C2. Explain why Spearman's rank, not the t-test, was used for the transect data in core practical 11, and when the t-test would be the right choice. (5.14) (2)
C3. Explain how the niche of a plant species helps to explain where it is found in a habitat. (5.13) (2)
Reveal the answers to Part C
C1 (3)
- Expected = 30 on each side (1)
- χ2 = (112 ÷ 30) × 2 = 8.07 (1)
- 8.07 is greater than 3.84: a significant preference for the damp side (1)
- ACCEPT 2 or 3 significant figures for χ2
- ALLOW ecf from the expected value
C2 (2)
- A transect tests for a correlation between two measured variables (1)
- The t-test compares the means of two groups, e.g. two areas (1)
- ACCEPT "Spearman's rank" for the first point
C3 (2)
- It survives only where the conditions and resources suit its niche (1)
- So it is found only in those parts of the habitat, e.g. shade or damp soil (1)