The Chromozone / IAL Biology / Unit 4 / Topic 5
Directed study: evidence, greenhouse gases and the carbon cycle
Work through this on your own after the lesson on greenhouse gases and the carbon cycle. Part 1 checks that lesson and the one before it, evidence for climate change; part 2 is exam-style questions; part 3 looks back at photosynthesis and ecology, earlier in the unit. The spec point in brackets tells you where to revise. It takes about 35 minutes (29 marks), and you need a calculator. Type your answer in the box under each question, then press Hand in at the bottom of the page. The mark schemes open after you hand in: then mark yourself point by point. Teachers: this is the page to set as homework.
Teach these first
This page builds on these lessons. Teach them before students start here:
Part 1: retrieval (8 marks) 8 min
Answer from memory first. Then check your notes for anything you could not remember.

- Explain why life on Earth needs the natural greenhouse effect, and what is meant by the enhanced greenhouse effect. (5.17) (2)
- State what is meant by a carbon sink, and give two examples. (5.18) (2)
- Explain why a young, growing forest takes more carbon dioxide out of the air each year than an old, mature forest. (5.18) (2)
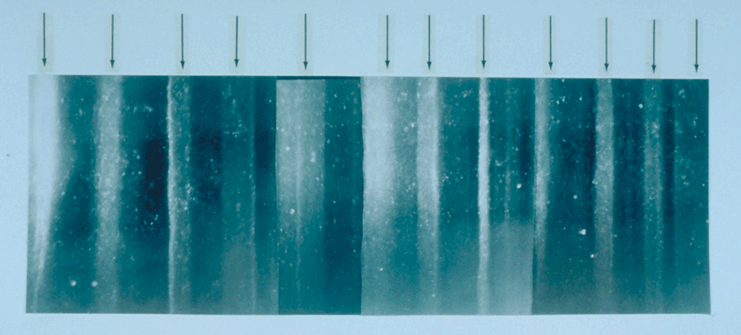
- Look at the ice core. State what is measured in the ice to estimate (i) the air temperature and (ii) the carbon dioxide level when the snow fell. (5.16) (2)
Reveal the mark scheme for part 1
1. Natural and enhanced (2)
- without it the surface would be about −18 °C, too cold for most life (1)
- enhanced: extra greenhouse gases from humans re-radiate more infrared, so more warming (1)
- DO NOT ACCEPT the enhanced effect is caused by the ozone hole
2. Carbon sinks (2)
- takes in more carbon than it releases, and stores it (1)
- two of: a growing forest, the oceans, peat bogs, soil (1)
- ACCEPT phytoplankton for the oceans
3. Young and old forests (2)
- young trees fix more carbon by photosynthesis than they lose by respiration (high NPP) (1)
- in an old forest, photosynthesis is about equal to respiration and decay (1)
- DO NOT ACCEPT old trees do not photosynthesise
4. Ice cores (2)
- (i) the ratio of oxygen isotopes, 18O to 16O, in the ice (1)
- (ii) the carbon dioxide in the trapped air bubbles (1)
- NB both answers are needed
Part 2: exam-style questions (13 marks) 16 min
Allow about a minute per mark. Use the command word: calculate needs working and a unit, explain gives reasons, linking cause to effect.
- 1. The graph shows how the thickness of a mountain glacier changed from 2000 to 2020.
(a) Calculate the mean loss of thickness per year from 2000 to 2020. Give the unit. (5.17) (1) - (b) Explain why the glacier lost thickness faster from 2015 to 2020 than from 2000 to 2005. (5.17) (3)
- 2. A country plans to double its beef and rice production by clearing an area of forest for farmland. Explain how this plan could add to the greenhouse effect. (5.17) (3)
- 3. Oak beams were found in an old barn. Look at the diagram. Explain how matching tree rings with a core from a living oak can show the year in which each beam's tree was cut down. (5.16) (3)
- 4. In spring, a huge bloom of phytoplankton grows in the surface of an ocean. Many of the cells die and sink to the deep sea floor. Explain how this could lower the concentration of carbon dioxide in the atmosphere. (5.18) (3)
Reveal the mark scheme for part 2
Question 1(a) (1)
- 11.5 ÷ 20 = 0.58 m per year (1)
- ACCEPT 0.575 or 0.58 (2 or 3 significant figures)
- DO NOT ACCEPT an answer with no unit
Question 1(b) (3)
- greenhouse gas concentrations (carbon dioxide) kept rising (1)
- more infrared absorbed and re-radiated: enhanced greenhouse effect (1)
- so air temperatures rose, and more ice melted each year (1)
- ACCEPT less snow cover leaves darker ice that absorbs more energy
Question 2 (3): any three
- cattle release methane from digestion (1)
- flooded rice fields release methane (from microorganisms) (1)
- clearing or burning the forest releases carbon dioxide (1)
- fewer trees, so less carbon dioxide removed by photosynthesis (1)
- ACCEPT fertilisers release nitrous oxide
- ACCEPT farm machines burn fossil fuels
- Max 3
Question 3 (3)
- each ring is one year; wide and narrow rings make a pattern (1)
- match the pattern where the beam and living tree overlap (1)
- count back from 2024 to date each ring; the beam's outer ring is the felling year (1)
Question 4 (3)
- phytoplankton take in carbon dioxide for photosynthesis (1)
- carbon in sinking cells is stored in the deep sea for a long time (1)
- surface water then takes up more carbon dioxide from the air (1)
Part 3: looking back at photosynthesis and ecology (8 marks) 8 min
Spaced practice from Topics 5A and 5B, earlier in this unit.
- Pondweed was given more and more carbon dioxide, at a fixed, low light intensity. Explain why its rate of photosynthesis rose at first, then levelled off. (5.8) (2)
- Over 12 years, a student found a Spearman's rank correlation coefficient of +0.81 between the mean summer temperature and the number of one butterfly species counted. The critical value at p = 0.05 is 0.59. State what this result shows, and why it does not show that temperature causes the change. (5.14, 5.16) (2)
- Explain why producing 1 kg of beef needs much more land than producing 1 kg of wheat. (5.10) (2)
- A new forest is planted. Give two biotic factors that could limit the number of young trees that survive. (5.12) (2)
Reveal the mark scheme for part 3
1. Limiting factors (2)
- at first, carbon dioxide is the limiting factor (1)
- then light intensity limits the rate, so more carbon dioxide has no effect (1)
- DO NOT ACCEPT "the enzymes denature" (the light is low, not the temperature)
2. Spearman's rank (2)
- 0.81 is above 0.59: a significant positive correlation (1)
- a correlation only: another factor could cause it; a mechanism is needed (1)
- ALLOW reject the null hypothesis for the first point
3. Beef and wheat (2)
- cattle are a trophic level higher than wheat (primary consumers) (1)
- only about 10% of the energy passes on; most is lost in respiration, heat and faeces (1)
4. Biotic factors (2)
- competition for light (or water) from other plants (1)
- herbivores (grazing deer), pests or disease (1)
- DO NOT ACCEPT temperature or soil pH (these are abiotic)