The Chromozone / IAL Biology / Unit 4 / Topic 5
Topic 5C revision: climate change
Revision for the Topic 5C test: one screen for each spec point, 5.16 to 5.20. On each screen, answer the from-memory question first, then read the key words and key facts, do the quick check and read the common mistakes. Mark the quick checks yourself. The self-check at the end (20 marks) can be handed in online: its mark scheme opens after you hand in. It takes about 45 minutes.
Teach these first
This page builds on these lessons. Teach them before students start here:
5.16 Evidence for climate change: from memory first (2 marks) 1 min
Before you read: name the four types of evidence for climate change in the specification. (2)
Reveal the answer
- records of carbon dioxide levels; temperature records (1)
- pollen in peat bogs; tree rings (dendrochronology) (1)
- two of the four types for 1 mark; all four for 2 marks
Key words: evidence (5.16)
- Temperature proxy
- An indirect measure of past temperature, taken from preserved records such as ice cores or tree rings.
- Dendrochronology
- Using tree rings to date past years and to show what the growing conditions were like.
- Correlation
- Two variables change together, so a relationship exists between them.
- Causation
- A change in one variable directly causes a change in the other, through a known mechanism.
5.16 Types of evidence: key facts
| Evidence | What it shows |
|---|---|
| Carbon dioxide records | Measured at Mauna Loa since 1958 (the Keeling Curve): 316 ppm in 1959, 427 ppm in 2025, with a small rise and fall every year. |
| Temperature records | Thermometers since the mid-1800s. In 2024 the world was about 1.5 °C warmer than the 1850 to 1900 average. |
| Ice cores | Oxygen isotopes in each yearly layer show the temperature; trapped air bubbles show the carbon dioxide. Up to about 800,000 years. |
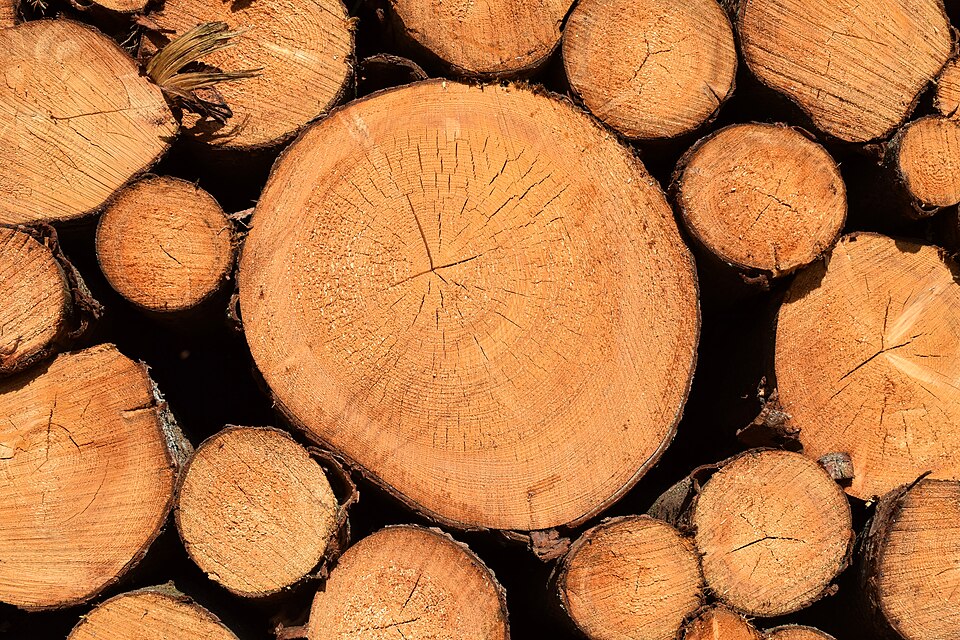
| Tree rings | One ring a year. Wide: a good growing season (warm and wet enough). Narrow: a poor one (cold or dry). |
| Pollen in peat bogs | Acidic, waterlogged, no oxygen, so pollen does not decay. Deeper layers are older. The plants show the climate: oak and lime, warmer; birch, cooler. |
Carbon dioxide and temperature rise together: that is a correlation. To show that carbon dioxide causes the warming, you need a mechanism: the greenhouse effect (5.17).

Quick check 5.16 (3 marks) 2 min
- Give one reason why Mauna Loa, Hawaii, is a good place to measure the carbon dioxide level of the whole atmosphere. (1)
- Spot the mistake: "The Keeling Curve shows that carbon dioxide causes global warming." Correct it. (2)
Reveal the answers
1. (1)
- it is far from cities and forests, so the air is well mixed (1)
2. (2)
- it shows only that carbon dioxide has risen; with temperature, a correlation (1)
- a cause needs a mechanism: the greenhouse effect (1)
- DO NOT ACCEPT "the graph proves the cause"
Common misconceptions and exam errors (5.16)
- "Carbon dioxide peaks in winter." It rises through autumn and winter and peaks in May. It falls through the summer, when plants photosynthesise most.
- Mixing up the two ice-core measurements. Temperature comes from the oxygen isotopes in the ice. Carbon dioxide comes from the air bubbles.
5.17 The greenhouse effect: from memory first (2 marks) 1 min
Put these in order: A the warm surface gives out infrared radiation; B greenhouse gases absorb the infrared and re-radiate it; C short-wavelength radiation from the Sun passes through the atmosphere and warms the surface; D some radiation returns to the surface, so it stays warmer. (2)
Reveal the answer
- C, A (1)
- B, D (1)
- NB all four in order: 2 marks; one pair swapped: 1 mark
Key words: anthropogenic climate change (5.17)
- Anthropogenic
- Caused or produced by human activities, such as industry, farming and burning fossil fuels.
- Greenhouse gases
- Gases that absorb infrared radiation: carbon dioxide (CO2), methane (CH4) and water vapour.
- Greenhouse effect
- Greenhouse gases absorb and re-radiate infrared radiation, keeping the Earth's surface warm enough for life.
- Enhanced greenhouse effect
- Extra warming because human activities add more greenhouse gases to the air.
5.17 How humans add greenhouse gases: key facts
| Human activity | Gas | Why it adds to the air |
|---|---|---|
| Burning coal, oil and gas | CO2 | Carbon locked away in fossil fuels for millions of years is released. |
| Cutting down and burning forests | CO2 | Carbon in the wood is released, and fewer trees take carbon dioxide in. |
| Cattle and rice fields | CH4 | Farming releases methane, another greenhouse gas. |
Carbon dioxide has risen from about 280 ppm before 1750 to over 420 ppm today. Without the natural greenhouse effect the Earth's surface would be about −18 °C, not about 15 °C.
Quick check 5.17 (2 marks) 2 min
- Explain why the natural greenhouse effect matters for life on Earth. (1)
- Spot the mistake: "Greenhouse gases trap the Sun's light." Correct it. (1)
Reveal the answers
1. (1)
- it keeps the surface warm enough for life: about 15 °C, not −18 °C (1)
2. (1)
- sunlight passes through; the gases absorb infrared from the warm surface (1)
- DO NOT ACCEPT gases trap sunlight
Common misconceptions and exam errors (5.17)
- "The greenhouse effect is the problem." The natural effect keeps the Earth warm enough for life. The problem is the enhanced effect from human emissions.
- Mixing up global warming and the ozone hole. They are different problems. The ozone hole lets more ultraviolet through; it does not cause the warming.
5.18 The carbon cycle: from memory first (2 marks) 1 min
Name two processes that return carbon dioxide to the air. (2)
Reveal the answer
- respiration (by plants, animals and decomposers) (1)
- combustion (burning fossil fuels or wood) (1)
- DO NOT ACCEPT photosynthesis
Key words: reducing carbon dioxide (5.18)
- Carbon sink
- Something that takes in more carbon than it releases, and stores it, such as a growing forest or the oceans.
- Afforestation
- Planting trees on land that has not had forest for a long time.
- Reforestation
- Replanting trees where a forest has been cut down or lost.
- Carbon capture and storage (CCS)
- Capturing carbon dioxide where it is made, such as at a power station, and storing it deep underground.
5.18 Using the carbon cycle to cut carbon dioxide: key facts
| Method | How it works (carbon cycle) |
|---|---|
| Afforestation and reforestation | Young trees have a high NPP: they fix more carbon by photosynthesis than they release by respiration. The carbon is stored in wood, roots and soil for decades. |
| Protecting the oceans | The oceans hold about 50 times more carbon than the air. Phytoplankton photosynthesise; when they die, some carbon sinks to the deep ocean. |
| Carbon capture and storage | Carbon dioxide is caught at power stations and cement works and stored in old oil and gas fields, so it never reaches the air. |
| Burning less fossil fuel | Less combustion, so less carbon leaves its long-term store. |
Quick check 5.18 (3 marks) 2 min
- Name the carbon store that holds about 50 times more carbon than the atmosphere, and the organisms in it that take in carbon dioxide. (2)
- Spot the mistake: "Carbon capture and storage takes carbon dioxide out of the air by planting trees." Correct it. (1)
Reveal the answers
1. (2)
- the oceans (1)
- phytoplankton (1)
2. (1)
- CCS catches carbon dioxide where it is made and stores it underground (1)
Common misconceptions and exam errors (5.18)
- "Plants only take in carbon dioxide." Plants respire all the time too. A forest is a sink only while photosynthesis is greater than respiration.
- "A forest stores carbon for ever." Fire, felling or decay releases the stored carbon back into the air.
5.19 Climate models: from memory first (2 marks) 1 min
State what is meant by extrapolation, and the assumption it makes. (2)
Reveal the answer
- extending a trend beyond the data to predict future values (1)
- it assumes the trend carries on unchanged (1)
Key words: models (5.19)
- Extrapolation
- Extending a trend in known data beyond the data, to predict future values.
- Climate model
- A large computer program that simulates how the atmosphere, oceans and land interact, to predict future climate.
- Scenario
- A possible future path for population, energy use and emissions, used as an input to climate models.
5.19 Predictions and their limits: key facts
| Idea | Key fact |
|---|---|
| Extrapolation | Extends a trend. The 1980 to 2000 trend predicted about 407 ppm for 2025; the real value was 427 ppm. |
| Climate models | Use the laws of physics to simulate air, oceans, land and ice. They are tested on the past first, then run forward. |
| Scenarios | Possible futures, from low emissions (SSP1-1.9) to high (SSP5-8.5). The models are run for each one. |
| Limitations | Future emissions, population, policies and new technologies cannot be known, so results are a range, not one line. |
Quick check 5.19 (3 marks) 2 min
- Before a climate model is used to predict 2100, it is run on the years 1900 to 2020. Explain why. (2)
- Spot the mistake: "Extrapolation is accurate as long as you have enough data." Correct it. (1)
Reveal the answers
1. (2)
- to check its output matches the real past records (1)
- if it does, we can trust its predictions more (1)
2. (1)
- it assumes the trend continues; the further ahead, the less certain (1)
Common misconceptions and exam errors (5.19)
- "Models predict exactly what will happen." They give a range of possible results, because future emissions and some processes are uncertain.
- "A scenario is a prediction." A scenario is an input: one possible future for emissions. The model then predicts the climate for that scenario.
5.20 Effects on living things: from memory first (2 marks) 1 min
The specification names three things about plants and animals that climate change affects. Name them. (2)
Reveal the answer
- distribution of species (1)
- development and lifecycles (1)
- NB three named: 2 marks; two named: 1 mark
Key words: effects on living things (5.20)
- Distribution
- Where a species is found.
- Ectotherm
- An animal whose body temperature depends on its surroundings, such as an insect, fish or reptile.
- Lifecycle
- The stages an organism passes through from egg or seed to adult and reproduction.
- Seasonal cycle
- Events that happen at the same time each year, such as budburst, flowering, insects emerging and breeding.
5.20 What climate change does to plants and animals: key facts
| Effect | Examples |
|---|---|
| Rainfall patterns | Longer droughts (East Africa, the Mediterranean): crops fail. Heavier monsoons and floods (Pakistan, 2022) wash nutrients out of soil. |
| Seasonal cycles | Spring events come days or weeks earlier. Caterpillars peak earlier, but the great tit's laying date has moved much less, partly because day length also controls it. |
| Distribution | Species move towards the poles or up mountains. 63% of 35 European butterfly species studied moved north, by 35 to 240 km. |
| Development | Warm ectotherms develop faster. Warm water holds less oxygen, so fish grow more slowly. Corals bleach. Egg temperature sets the sex of sea turtles. |
| Lifecycles | Insects pass temperature thresholds sooner: more generations a year. Mosquitoes and malaria spread to higher ground. |
Quick check 5.20 (3 marks) 2 min
- Explain why warmer water can slow down the growth of fish. (2)
- Spot the mistake: "Climate change only affects where species live." Correct it. (1)
Reveal the answers
1. (2)
- warmer water holds less dissolved oxygen (1)
- but the fish need more oxygen for faster respiration, so they are stressed (1)
2. (1)
- it also changes their development and the timing of their lifecycles (1)
Common misconceptions and exam errors (5.20)
- "Less rain means less water for photosynthesis." The main effect is that stomata close, so less carbon dioxide enters the leaf.
- "Animals decide to move north." Ranges shift because populations survive and breed better in newly suitable places, and die out where it becomes too warm.
Self-check: Topic 5C (20 marks) 20 min
Exam-style questions on every spec point, 5.16 to 5.20. Allow about a minute per mark. Type your answers in the boxes and hand them in at the end.
- 1. A core was taken from a peat bog. Birch pollen was common in a deep layer. Oak and lime pollen were common in a layer nearer the surface. Explain what this suggests about how the climate changed. (5.16) (3)
- 2. The mean carbon dioxide concentration at Mauna Loa was 320 ppm in 1965 and 414 ppm in 2020. Calculate the mean increase per year. Give your answer to two significant figures. (5.16) (2)
- 3. Explain how human activities have increased the greenhouse effect. (5.17) (3)
- 4. Compare how carbon capture and storage (CCS) and reforestation reduce the concentration of carbon dioxide in the atmosphere. (5.18) (3)
- 5. A student drew a straight line through 20 years of carbon dioxide data and extended it to predict the concentration in 2080. Give two reasons why the prediction may be wrong. (5.19) (2)
- 6. Explain why climate scientists run their models for several different scenarios. (5.19) (2)
- 7. Over 40 years, the date of peak caterpillar numbers in a wood moved 16 days earlier. The mean date when a bird species hatches its chicks moved 5 days earlier. The chicks are fed on these caterpillars. Explain how this could affect the number of chicks that survive. (5.20) (3)
- 8. In some countries, malaria is now found on higher ground where it was not found before. Explain how rising temperature could cause this. (5.20) (2)
Reveal the self-check mark scheme
1. Pollen in peat (3)
- peat builds up in layers, so the deeper layer is older (1)
- birch in the older layer: the climate was cooler then (1)
- oak and lime later: the climate became warmer (1)
- NB the direction of change must be linked to the correct layer
2. Rate of increase (2)
- (414 − 320) ÷ 55 years (1)
- = 1.7 ppm per year (1)
- ACCEPT 1.71 ppm per year (or 1.7 ppm a year)
- NB the correct answer, 1.7, gains both marks
3. Human activities (3): max 3
- burning fossil fuels releases carbon dioxide (1)
- deforestation releases carbon dioxide; fewer trees take it in (1)
- cattle and rice fields release methane (1)
- more greenhouse gas absorbs and re-radiates more infrared, so the surface warms (1)
- Max 3
4. CCS and reforestation (3): max 3, with a similarity for full marks
- CCS catches carbon dioxide where it is made, before it reaches the air (1)
- CCS stores it underground (old oil and gas fields) (1)
- reforestation removes carbon dioxide already in the air, by photosynthesis (1)
- similarity: both lock carbon in a long-term store (1)
- DO NOT PIECE TOGETHER a similarity from two separate descriptions
- Max 3
5. Extrapolation (2)
- it assumes the trend continues; emissions may change (policy, population, technology) (1)
- the rise has been getting faster, so a straight line underestimates it (1)
- ACCEPT the further ahead, the less certain the prediction
6. Scenarios (2)
- future population, energy use and policies are not known (1)
- so scenarios give a range of possible futures to compare (1)
7. Timing mismatch (3)
- the gap between the food peak and hatching grew by 11 days (1)
- chicks hatch after the caterpillar peak, so less food when they need it (1)
- so fewer chicks survive (or they are lighter) (1)
- ALLOW ecf from an incorrect gap
8. Malaria (2)
- mosquitoes and the malaria parasite are ectotherms: they develop faster when warmer (1)
- higher ground is now warm enough for them to complete their lifecycles (1)
RAG self-assessment by spec point
Rate each spec point, 5.16 to 5.20, in your notebook. Go back to the lesson for anything red or amber before the Topic 5C test.
- Red: I could not answer the quick check or self-check on it without my notes.
- Amber: I knew the facts but lost marks on the explanation or the spot-the-mistake question.
- Green: I got full marks and could explain each answer.
Lessons: 5.16 evidence for climate change · 5.17 and 5.18 greenhouse gases and the carbon cycle · 5.19 and 5.20 climate models and effects